Guide · updated 25 October 2026
How to make a battery discharge curve with a Bluetooth multimeter
A discharge curve is a battery's voltage over time while it drives a load. With a Bluetooth multimeter and your phone you can log it unattended, instead of with a stopwatch and a notepad, and end up with a CSV or Excel file you can graph for a project log or a science fair.
iOS and Android, beta this winter.
What you need
- An OWON OW18B on DC volts.
- The battery, and a load: a resistor of known value, a bulb, or the device the battery normally powers.
- Test leads with clips that hold on their own, because a run can take hours.
- TestNMeasure on a phone that stays within Bluetooth range of the meter.
Stay within what the battery, the load and the wiring are rated for. Load resistors get hot. Stop at the cut-off voltage on the battery's data sheet, and never short a battery.
One meter, one channel
A multimeter measures one thing at a time, so with one meter a discharge curve logs voltage. To know the current as well:
- Use a known load. With a resistor of known value, current is voltage divided by resistance. A 10 Ω resistor at 1.2 V draws 0.12 A. Add that as a column in your spreadsheet.
- Or do a second run for current, with the meter on its A range in series with the load, and the same battery and load as before.
Step by step
- Start with a fully charged or new battery, and connect the load.
- Connect the meter in the app and set it to DC volts. Clip the leads across the battery terminals.
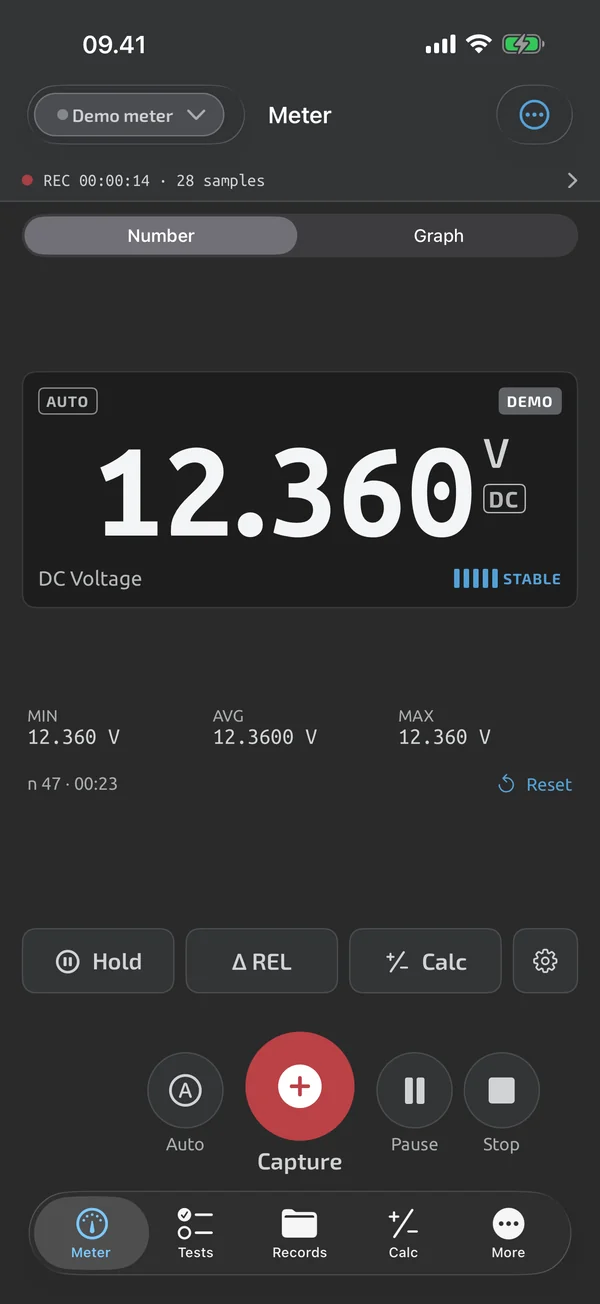
- Swipe the readout to the live graph and check that the reading is steady.
- Press Record and pick an interval: 10 s for a run of a few hours, 60 s for a day or more, 1 s for a fast discharge.
- Set an auto-stop after a duration that covers the whole run, for example 8 hours.
- Leave it. Lock the phone if you like; recording continues. If the Bluetooth connection drops, the app reconnects without ending the recording.
- When the battery reaches its cut-off voltage, disconnect the load and press Stop. The recording stops at the time or sample count you set, not at a voltage.
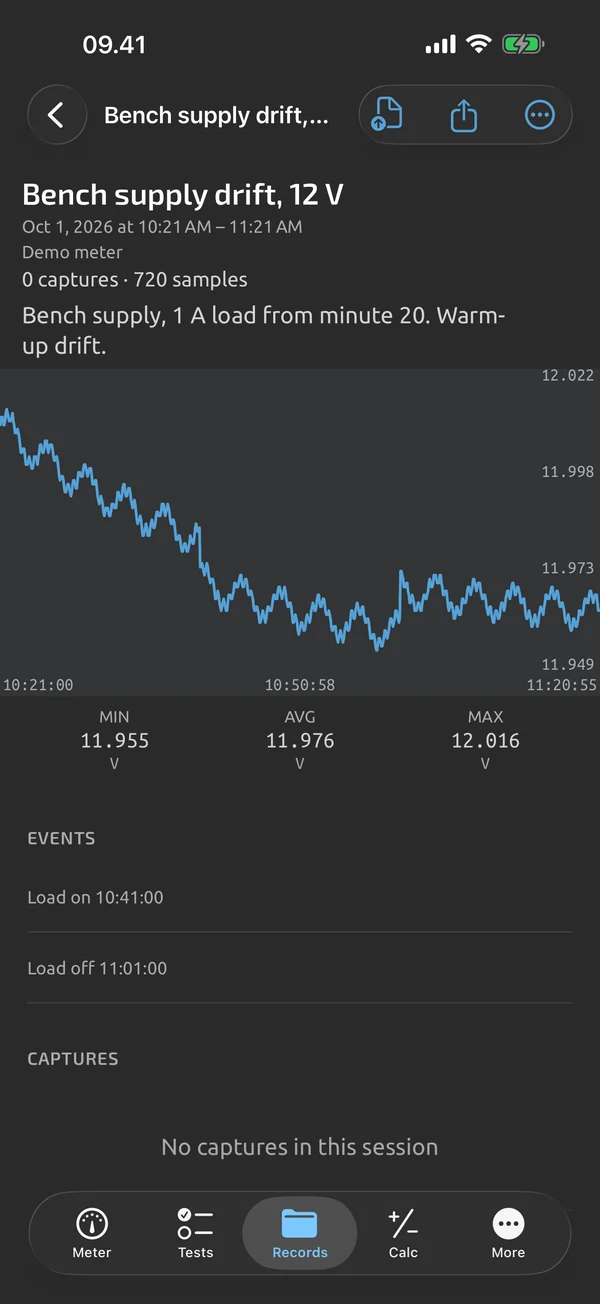
- Open the session in Records. The full-session graph shows the curve, with the minimum, maximum and average over the part you zoom to.
- Export it as Excel (.xlsx) or CSV and share it to your computer.
Graph it in Excel or Numbers
- In the Excel export, the Log sheet has real timestamps as Excel dates and a value per sample, and the Stats sheet has the minimum, maximum and average.
- Select the time and value columns and insert a scatter chart with lines. That is your discharge curve.
- For hours since the start, add a column with each time minus the first time, multiplied by 24.
- With a known load resistor, add a current column (voltage divided by resistance). The average current in mA times the hours gives an estimate of the capacity in mAh.
- For a science fair, the CSV opens in any spreadsheet, including Google Sheets, and keeps every value as it was recorded.
Reading the curve
Most batteries show a quick first drop, a long, slowly falling middle, and then a knee where the voltage falls fast. The knee is the end of useful capacity. Run the same test on two batteries with the same load and interval, and the curves compare directly.
What the app does here, and what it doesn't
| What it does | Plan |
|---|---|
| Log sessions hold captures and time-series recordings, and recording continues with the screen locked. | Free |
| Swipe the readout to a live graph with min and max lines, pan and zoom. | Free |
| Review a session as a full graph with pan and zoom, statistics and its captures. | Free |
| Export log sessions and test files as CSV, free. | Free |
| Export a log session to Excel with real timestamps and a statistics sheet. | Free |
Not yet, or not planned
- Reads what your meter measures; it doesn't change the meter's accuracy or ranges.
- One open recording per device; up to 1,000,000 samples per session.
- Can't download the meter's own memory yet.
Questions
Can it log voltage and current at the same time?
Not with one meter: a multimeter measures one quantity at a time. Log the voltage across a known resistor and calculate the current as voltage divided by resistance, or log the current in a second run.
Which interval should I use?
10 s for a run of a few hours, 60 s for a day or more, and 1 s for a fast discharge. A session holds up to 1,000,000 samples, so even 1 s covers more than 11 days.
Will the recording stop when the battery is flat?
It stops after the duration or the number of samples you set, not at a voltage. Disconnect the load at the cut-off voltage yourself, then press Stop.
Does the phone have to stay on?
No. Recording continues with the screen locked or the app in the background. Keep the phone within Bluetooth range of the meter.
Coming to iPhone and Android.
iOS and Android, beta this winter.


Questions or a meter to suggest? Mail support@testnmeasure.app.
No ad networks, no sign-up.