Live meter
Hold, REL, min/max/avg and rolling averages
Four tools under the readout: Hold, REL, min/max/avg and rolling averages. They work in the app, on whatever the meter sends.
iOS and Android, beta this winter.
Hold
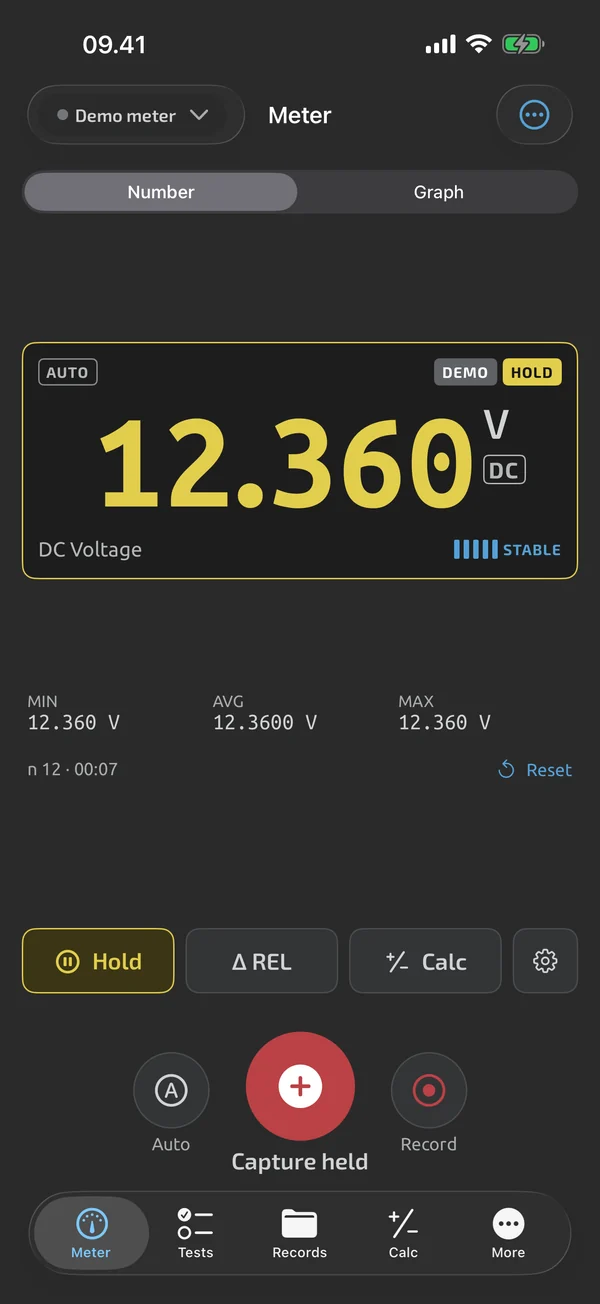
Tapping Hold freezes the readout, the statistics and the graph's auto-scroll. Readings keep arriving and the graph keeps buffering underneath. Tapping again releases it, and the readout jumps to the current value. A capture while held saves the held reading with its original timestamp. This is separate from the meter's own HOLD, which is shown as a flag; the app treats a value the meter holds as a normal reading.
REL
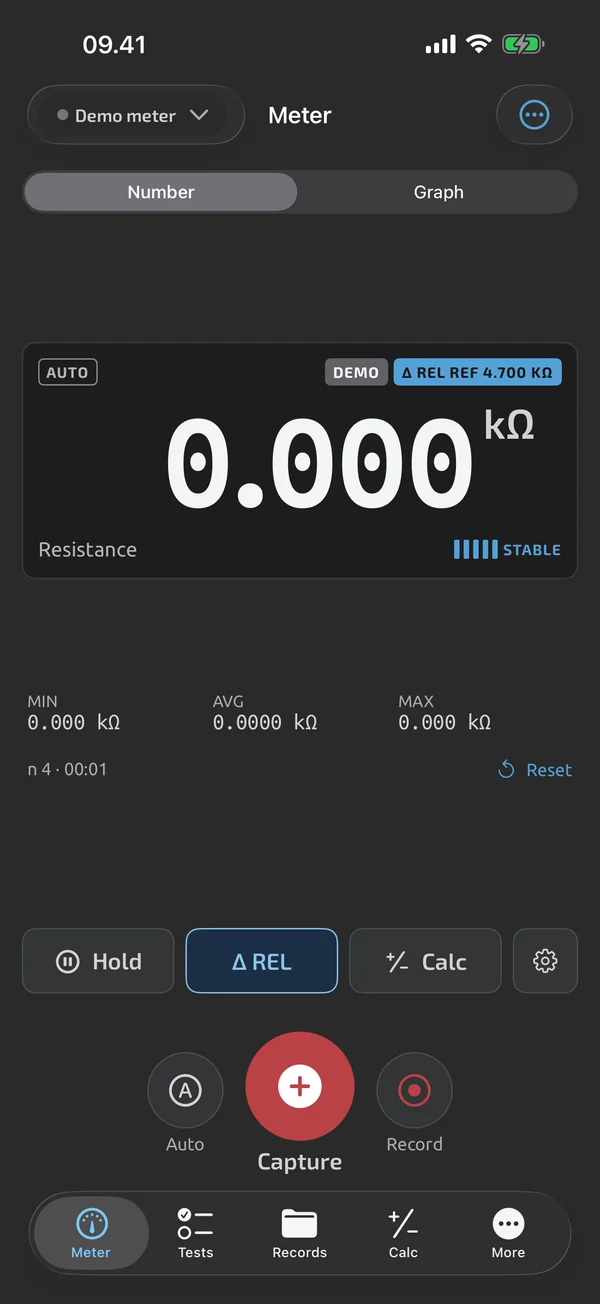
Tapping REL stores the current reading as the reference and shows the value minus the reference, with the same decimals, prefix and unit. The flags row shows the reference, for example ref 0.21 Ω. This is how you null out test-lead resistance. Tap again to clear it. A change of function or unit clears REL. A capture made with REL on stores the raw reading as well as the adjusted one.
Min, max and average
Under the readout are MIN, AVG and MAX since the last reset, with the sample count and the elapsed time. MIN and MAX show the exact extreme reading. Reset with the Reset button; the statistics also reset when the function, unit or prefix changes. Values are compared in SI units, so an autorange from mV to V does not reset them. OL and UL samples are left out, and a small counter shows how many.
Rolling averages
Expand the stats row for averages over the last 5 s, 30 s and 60 s. A window that has not filled yet shows how full it is. When the reading goes OL or UL, or drops to within ±5 counts of zero after being above that, the averages hold their last values and restart when a new reading arrives. That is the probe-lift case.
What it does and doesn't do (yet)
| What it does | Plan |
|---|---|
| Hold freezes the displayed reading and statistics in the app, independent of the meter's own HOLD. | Free |
| Shows the running minimum, maximum and average since the last reset, with the sample count. | Free |
| Shows rolling averages over the last 5, 30 and 60 seconds. | Free |
| REL shows the difference from a stored reference, for example to null out test-lead resistance. | Free |
Not yet, or not planned
- Meter-side MIN/MAX modes show as flags only.
Questions
Is app HOLD the same as the meter's HOLD?
No. The app's Hold freezes the readout, the statistics and the graph's auto-scroll in the app. The meter's own HOLD flag is shown in the flags row, and the app treats a value held by the meter as a normal reading.
What happens to the averages when I lift the probes?
When the reading goes OL or UL, or to within ±5 counts of zero after being above that, the rolling averages hold their last values, then restart when a new reading arrives.
Does an autorange from mV to V reset min/max?
No. Values are compared in SI units, so an autorange from mV to V does not reset the statistics. A change of function, unit or prefix does.
Coming to iPhone and Android.
iOS and Android, beta this winter.


Questions or a meter to suggest? Mail support@testnmeasure.app.
No ad networks, no sign-up.