Live meter
Swipe from number to live graph
Swipe the readout card sideways and the number becomes a live graph of the same readings.
iOS and Android, beta this winter.
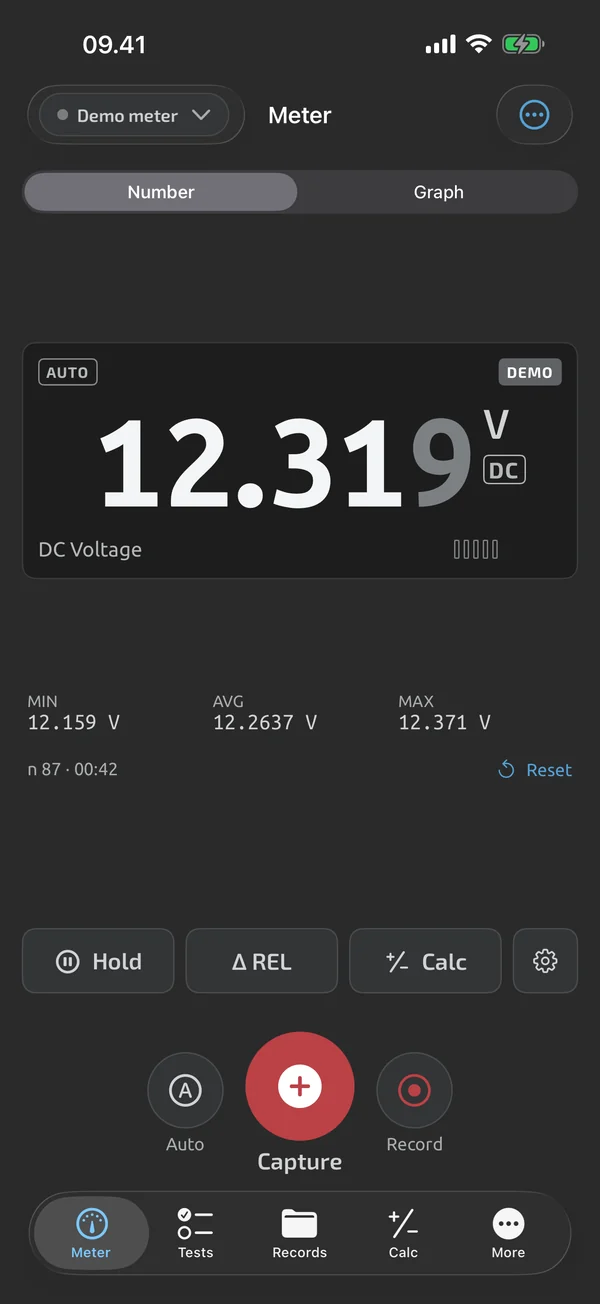
Number or graph
Swipe left on the readout card for the graph, swipe right for the number. A control above the card with the options Number and Graph does the same. Your choice is remembered.
What the graph shows
Time runs along the bottom, with the newest reading at the right. The default visible window is 30 s, and the graph scrolls on its own. The vertical scale fits the visible minimum and maximum with 20% extra, and changes only when a value leaves the current range, so it doesn't jitter. Dashed lines mark the visible min and max, the average in view sits at the top right, and the current value is at the top left.
Pan, zoom and read values
Drag to pan; auto-scroll pauses, and a Live pill resumes it. Pinch to zoom the time and value axes independently, or double-tap to zoom in 2x on time. Tap the trace to see a value box with the value and time; drag the box along the trace, and tap it to remove it.
OL and UL samples are drawn as markers at the top or bottom edge, not as values. A change of function or unit draws a vertical break line and restarts the scale.
How much it keeps
The graph keeps the last 10 minutes of readings in memory. Older samples drop unless a time-series log is recording. To keep more, record a log; the full session graph is on History and review.
What it does and doesn't do (yet)
| What it does | Plan |
|---|---|
| Swipe the readout to a live graph with min and max lines, pan and zoom. | Free |
Not yet, or not planned
- The live graph keeps the last 10 minutes; record a log to keep more.
Questions
How much history does the live graph keep?
The last 10 minutes of readings. Older samples drop unless a time-series log is recording.
Can I zoom and read a value off the trace?
Yes. Pinch zooms the time and value axes independently, and double-tap zooms in 2x on time. Tap the trace to show a value box with the value and time.
Coming to iPhone and Android.
iOS and Android, beta this winter.


Questions or a meter to suggest? Mail support@testnmeasure.app.
No ad networks, no sign-up.